

Piggy Bank,3d Render
Sezeryadigar/E+ via Getty Images
Portfolio Changes in December
Starting in May, I have been reducing the volume of my monthly investment activity given elevated valuations and my desire to save cash either for investment or some other endeavors. The stock markets have been very kind to me over the last couple of years as I did manage to build some decent positions at a good cost basis. Nowadays, however, while the markets are continuing to move up with every dip getting bought ferociously, I hardly see any attractive prices.
That’s why my investment activity has come down and is almost exclusively geared towards dividend stocks. Performance in November for the broad market was slightly negative with the S&P500 dipping by 0.8% but overall stocks remained close to all-time highs. Volatility increased in December with the latest COVID-19 mutation, the Omicron variant, making headlines and concerning investors.
However, it seems that any moderate dip gets bought either on the next or the following day and so far I have seen nothing that can make me more confident in increasing my investment activity. On the contrary, it appears as if growth stocks are losing interest and momentum whereas good old value stocks are clearly outperforming in December. While many investors may like that I personally would have preferred stocks like APTS, ABBV or MO to remain in deeply undervalued territory so that I can grab more shares over time.
Investment activity in December amounting to only $530 giving a forced sale of Coresite Realty Corporation as the company was unfortunately acquired by American Tower Corporation (AMT). I am not in favor of that deal as I am losing a trusted dividend stock with great prospects at a time where yields have come down dramatically. So far I haven’t been able to adequately replace that lost dividend income as even previously out-of-favor stocks like AbbVie (ABBV) and surprisingly AT&T (T) have been soaring since December.
Purchases in December were also almost exclusively tied to my regular monthly investment plans with the remaining ones geared towards relatively high-yield stocks like AT&T as the stock was reaching decade-lows, New Residential Investment Corp. (NRZ) or AbbVie after the company just raised its dividend by a very healthy 8.5%.
Due to the nature of how the monthly investment plan process works, I am investing relatively equally into these stocks at two points of time during the month – at the beginning of the month and mid-month – which breaks down as shown below. Figures are in Euro and show that, for instance, at the beginning of the month, I am investing between 50 and 75 EUR each into Microsoft (NASDAQ:MSFT), The Home Depot (NYSE:HD), Visa (NYSE:V), W. P. Carey (NYSE:WPC), and BP (NYSE:BP). Mid-month, I am adding between 33 and 40 EUR each into STAG Industrial (NYSE:STAG), AT&T, NextEra Energy (NYSE:NEE), Toronto-Dominion Bank (NYSE:TD), Main Street Capital (NYSE:MAIN) and JPMorgan (NYSE:JPM.PK).
I have added several investment plans starting mid-September 2020 which include AGNC Investment Corp. (NASDAQ:AGNC), Ares Capital (NASDAQ:ARCC), Medical Properties Trust (NYSE:MPW), the Bank of Nova Scotia (NYSE:BNS) and The Trade Desk (NASDAQ:TTD). Investments here will be focused on high-yield as well as high-growth stocks in the technology, therapeutic and renewables sectors.
All those purchases substantially raised forward annual dividend income, breaking down as follows:
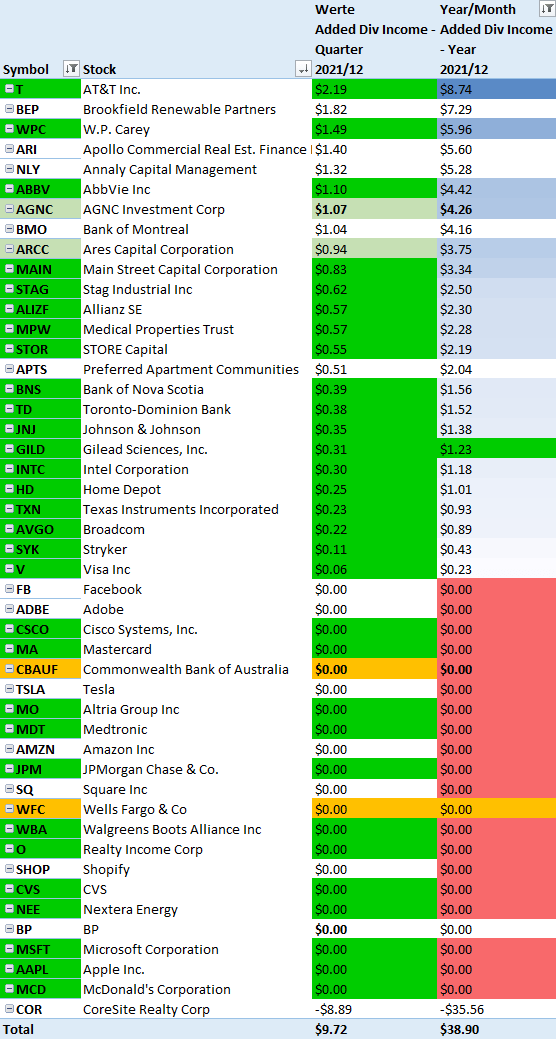
Added Dividend Income
Designed by author
All net purchases in December can be found below:
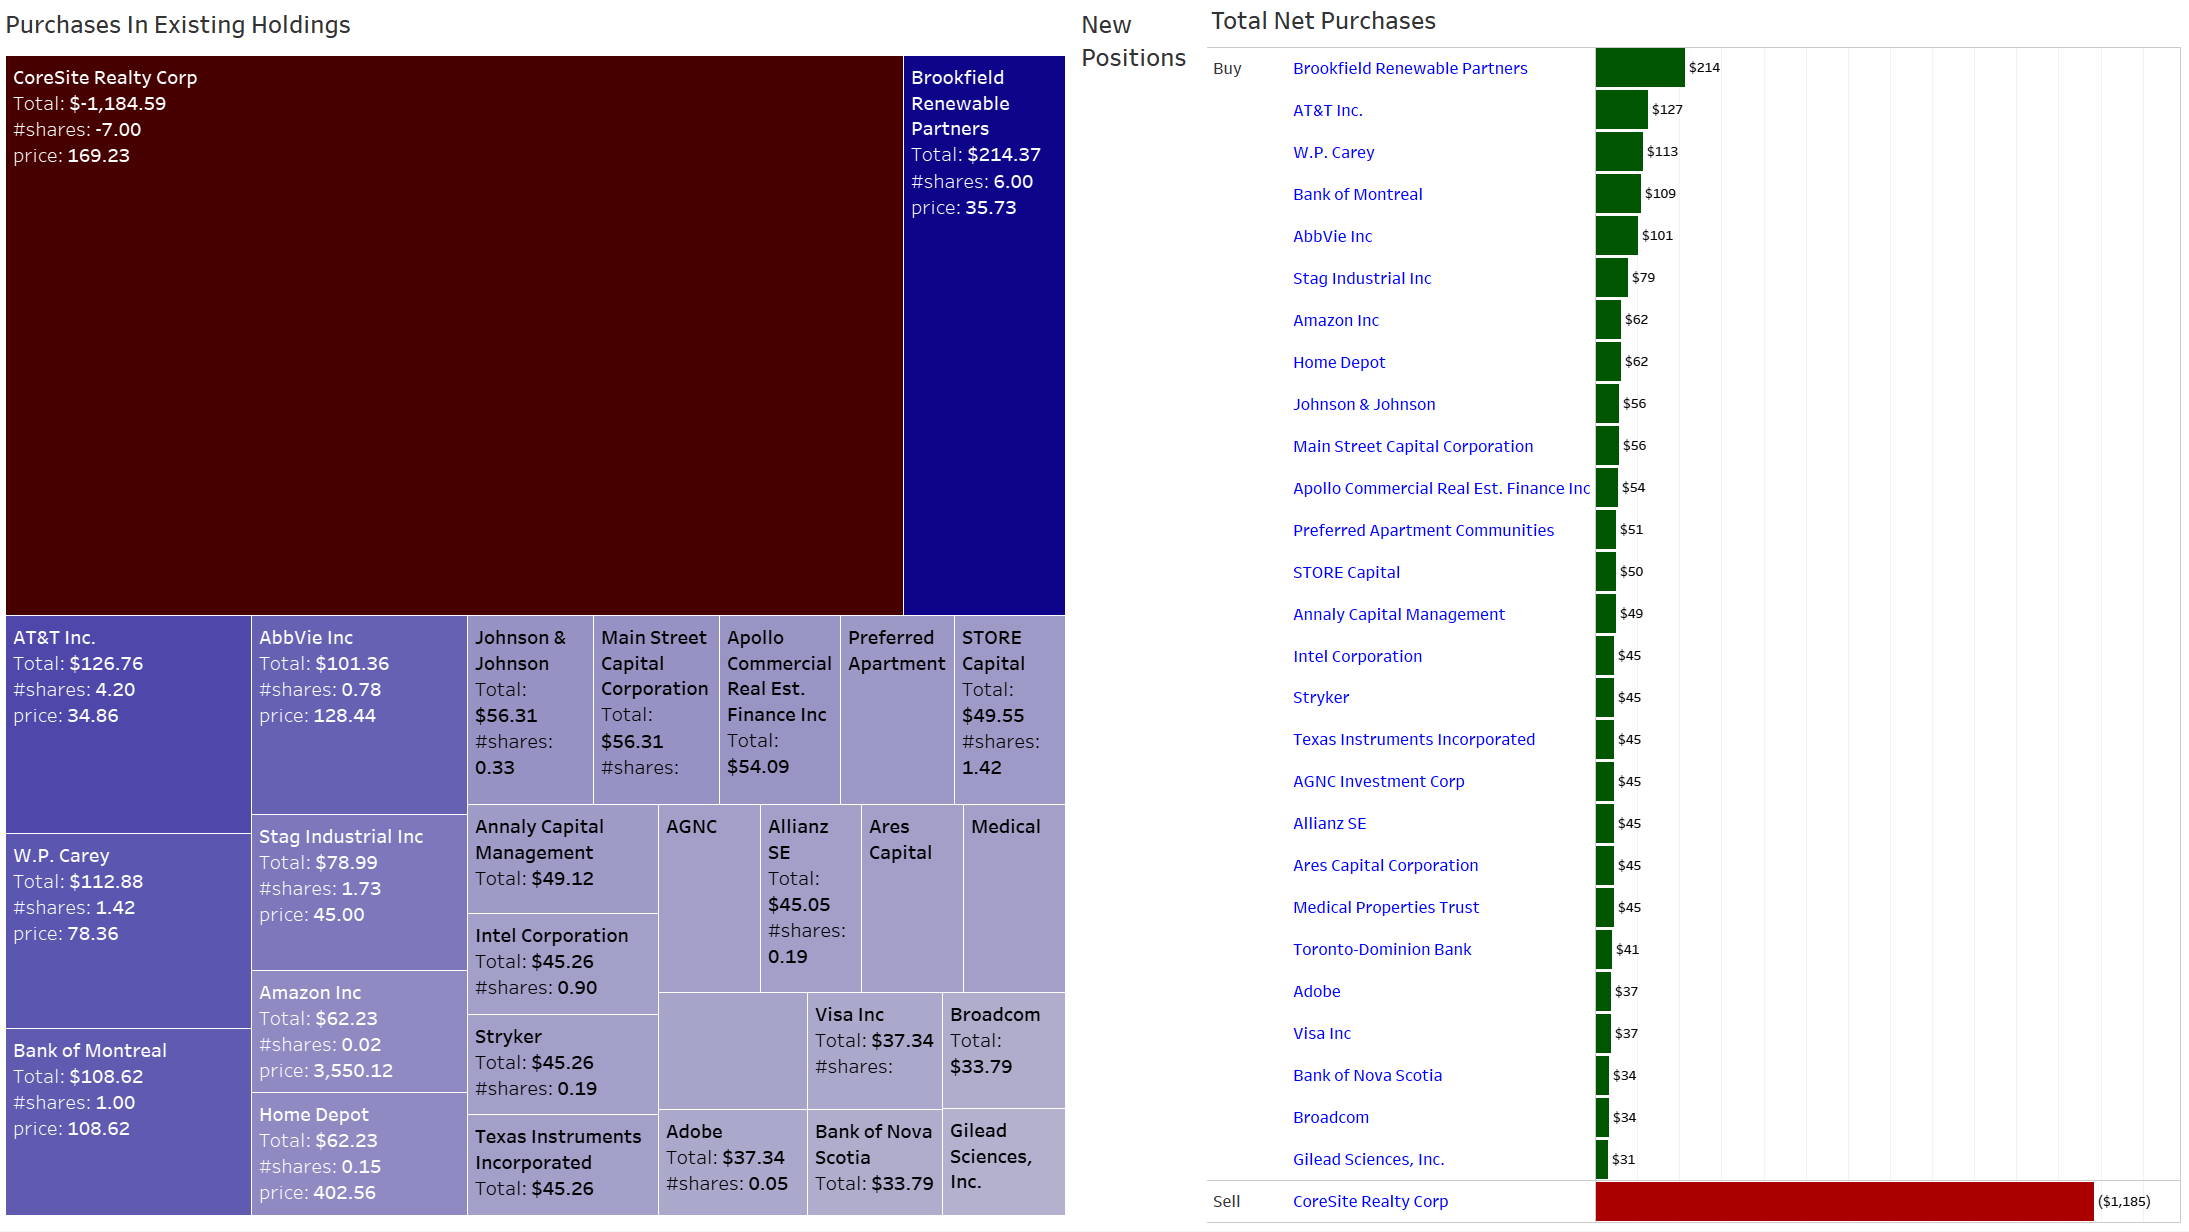
Net Purchases
Designed by author
Dividend Income: What Happened on The Dividend Side?
Dividend income hit a new December record of $446 and is up an explosive 52% Y/Y and down 25% sequentially. The sequential drop is solely explained by the semi-annual dividend paid by the Commonwealth Bank of Australia (OTCPK:CBAUF) in September as well as the annual dividend from Sino AG. Disregarding those effects sequential growth stacks up to 4%.
Apart from that with the exception of Royal Dutch Shell (RDS.B) (NYSE:RDS.A) the majority of that jump in annual dividend income is attributable to substantial investments over the last 12 months into stocks like Ares Capital Corporation (ARCC), Intel (INTC), Home Depot (HD) or Johnson & Johnson (JNJ). With regard to Shell we can see that there is a big jump in dividend income on a yearly basis which is the result of a massive dividend cut of 66% in April 2020 followed by a substantial hike of 38.3% in July 2021.
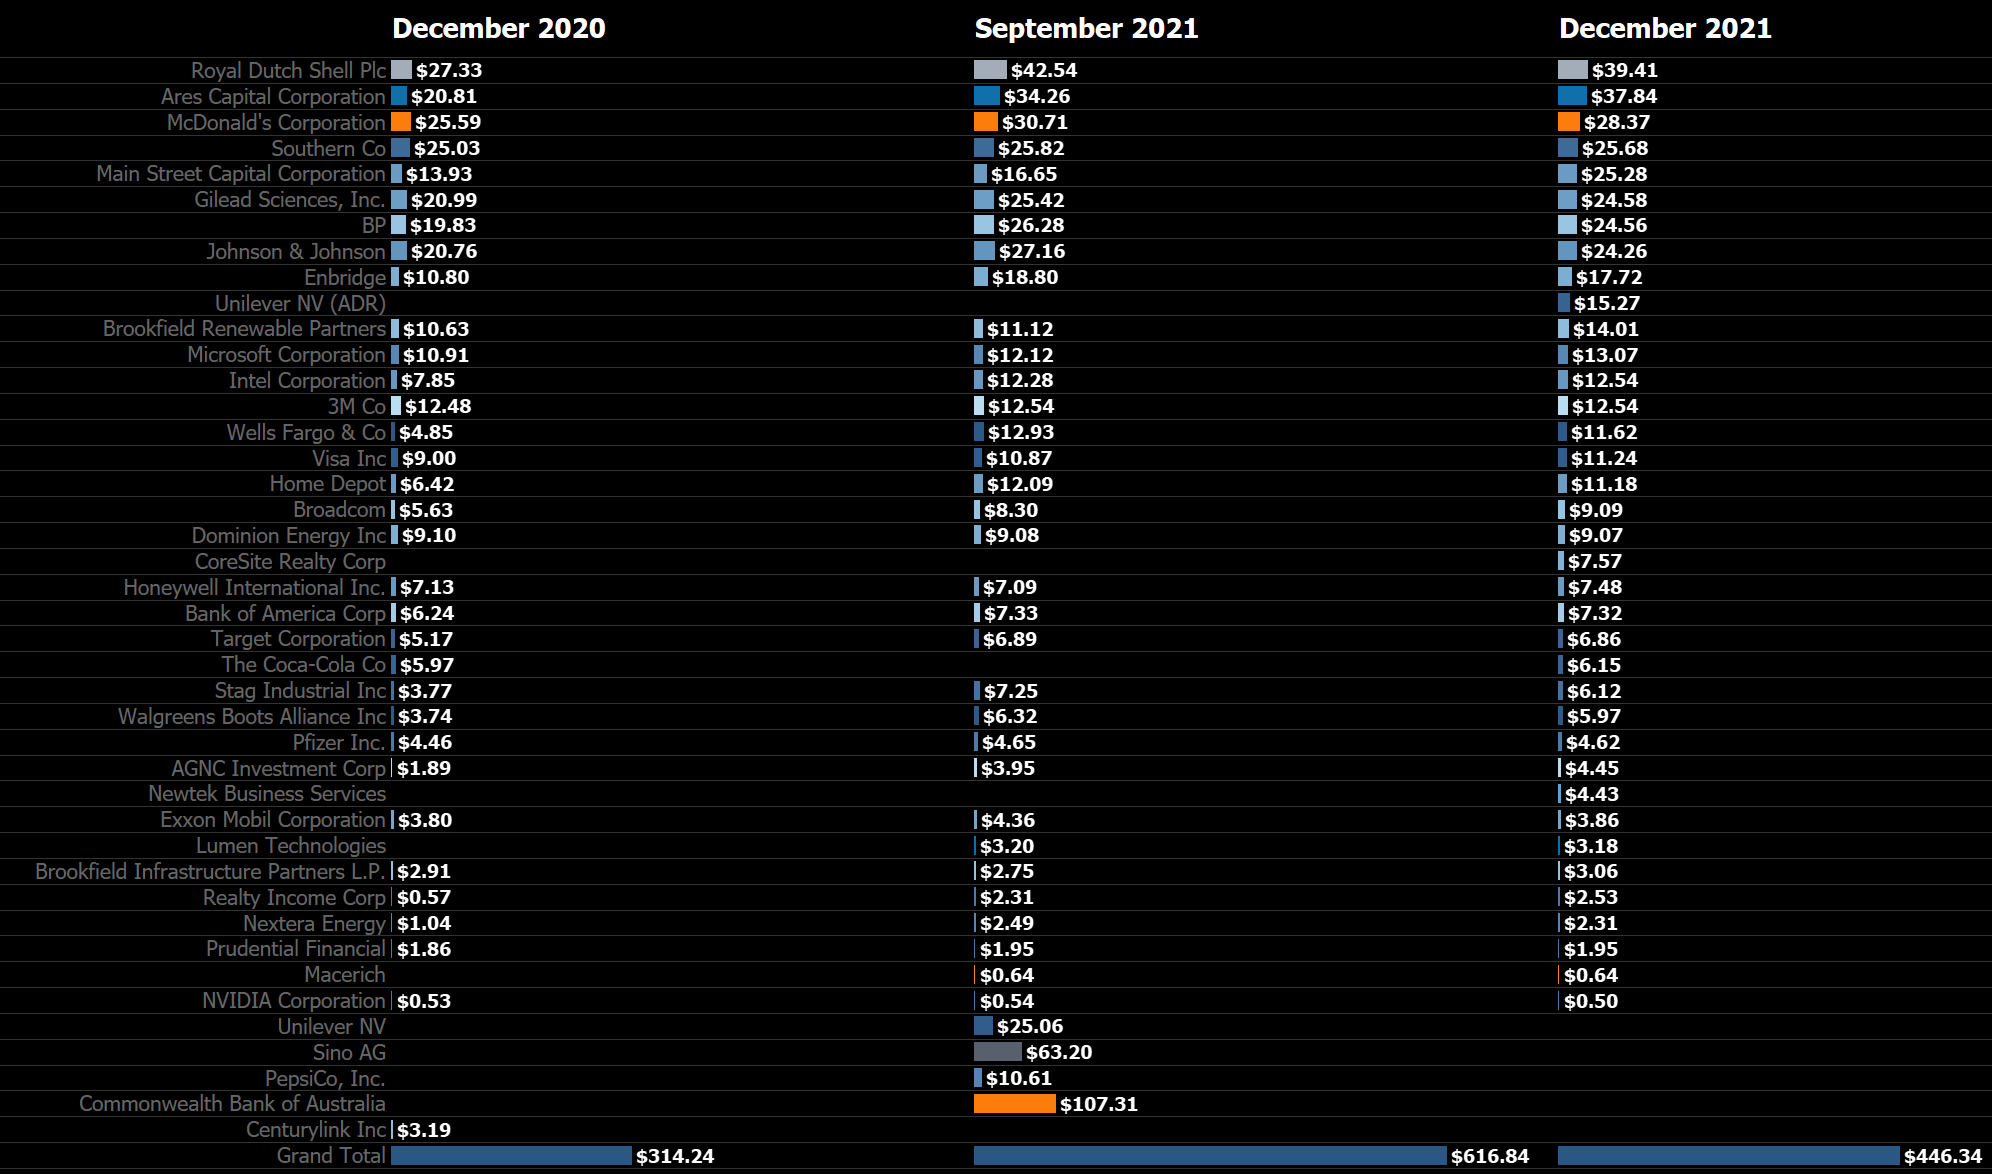
Dividend Income
Designed by author
Looking at the top three dividend payers in December, dividend income developed as follows:
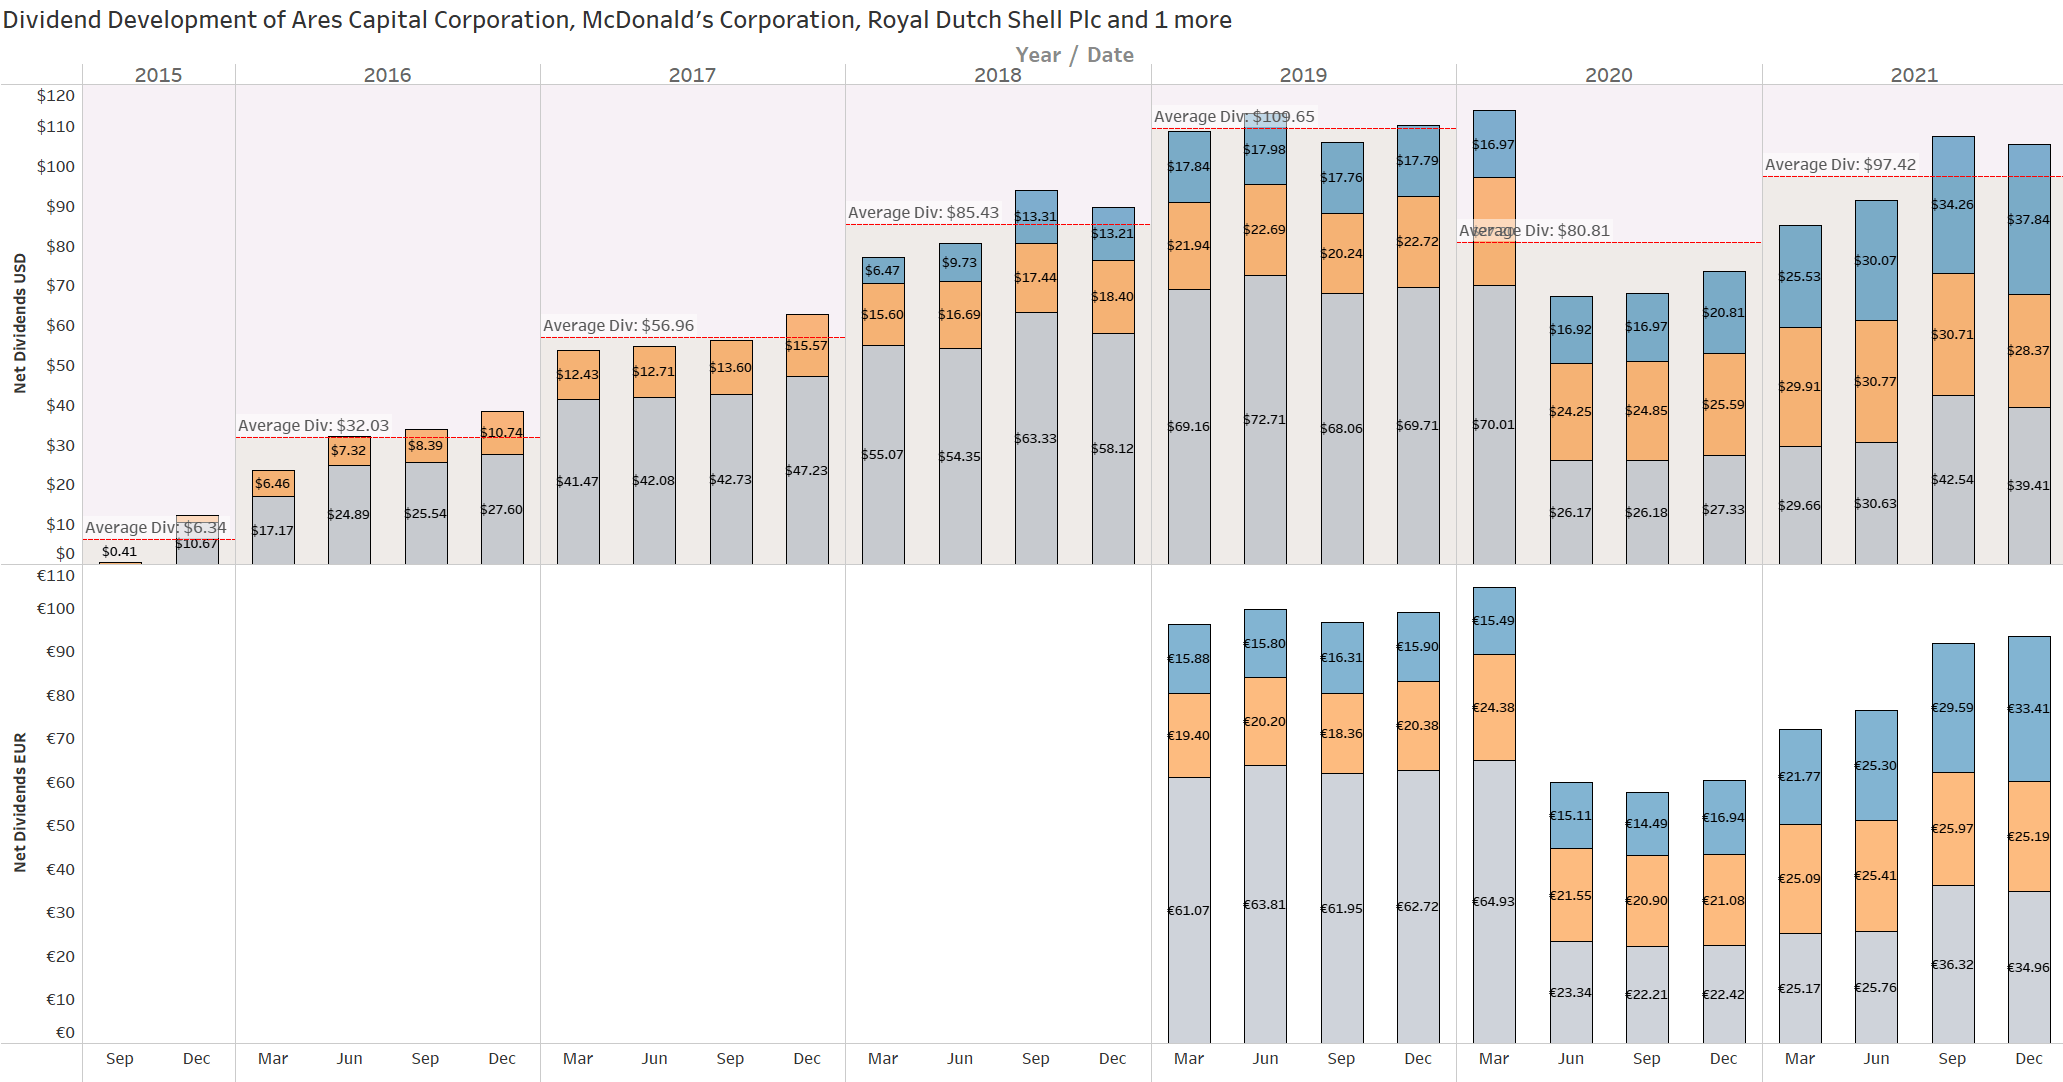
Top 3 Dividend Payers
Designed by author
Here is a look at my favorite chart: the net dividend income development by month over time between 2015 and 2021, where you can easily see the development of my dividend income as well as the average annual dividend in a given year:
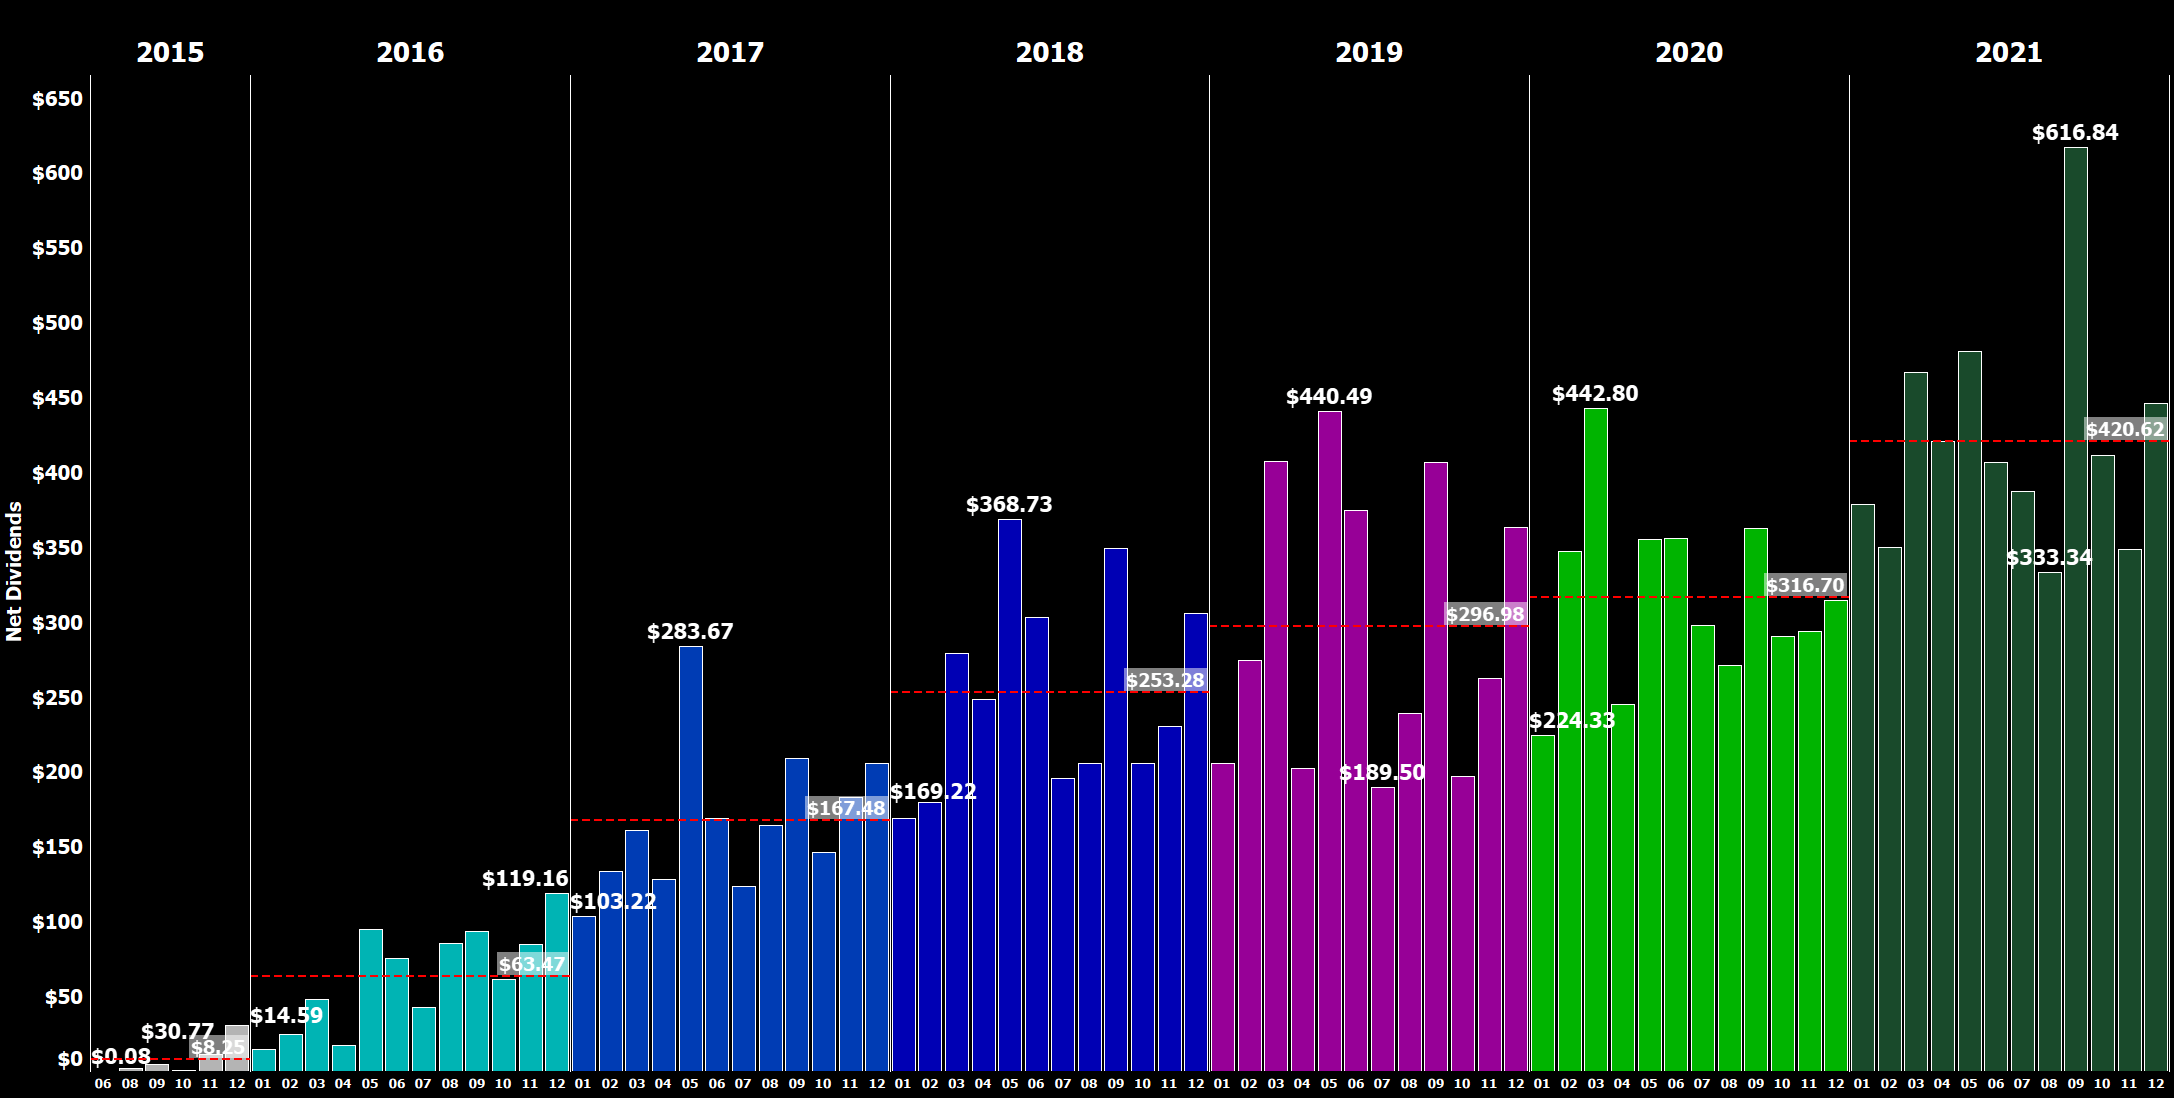
Dividend Development
Designed by author
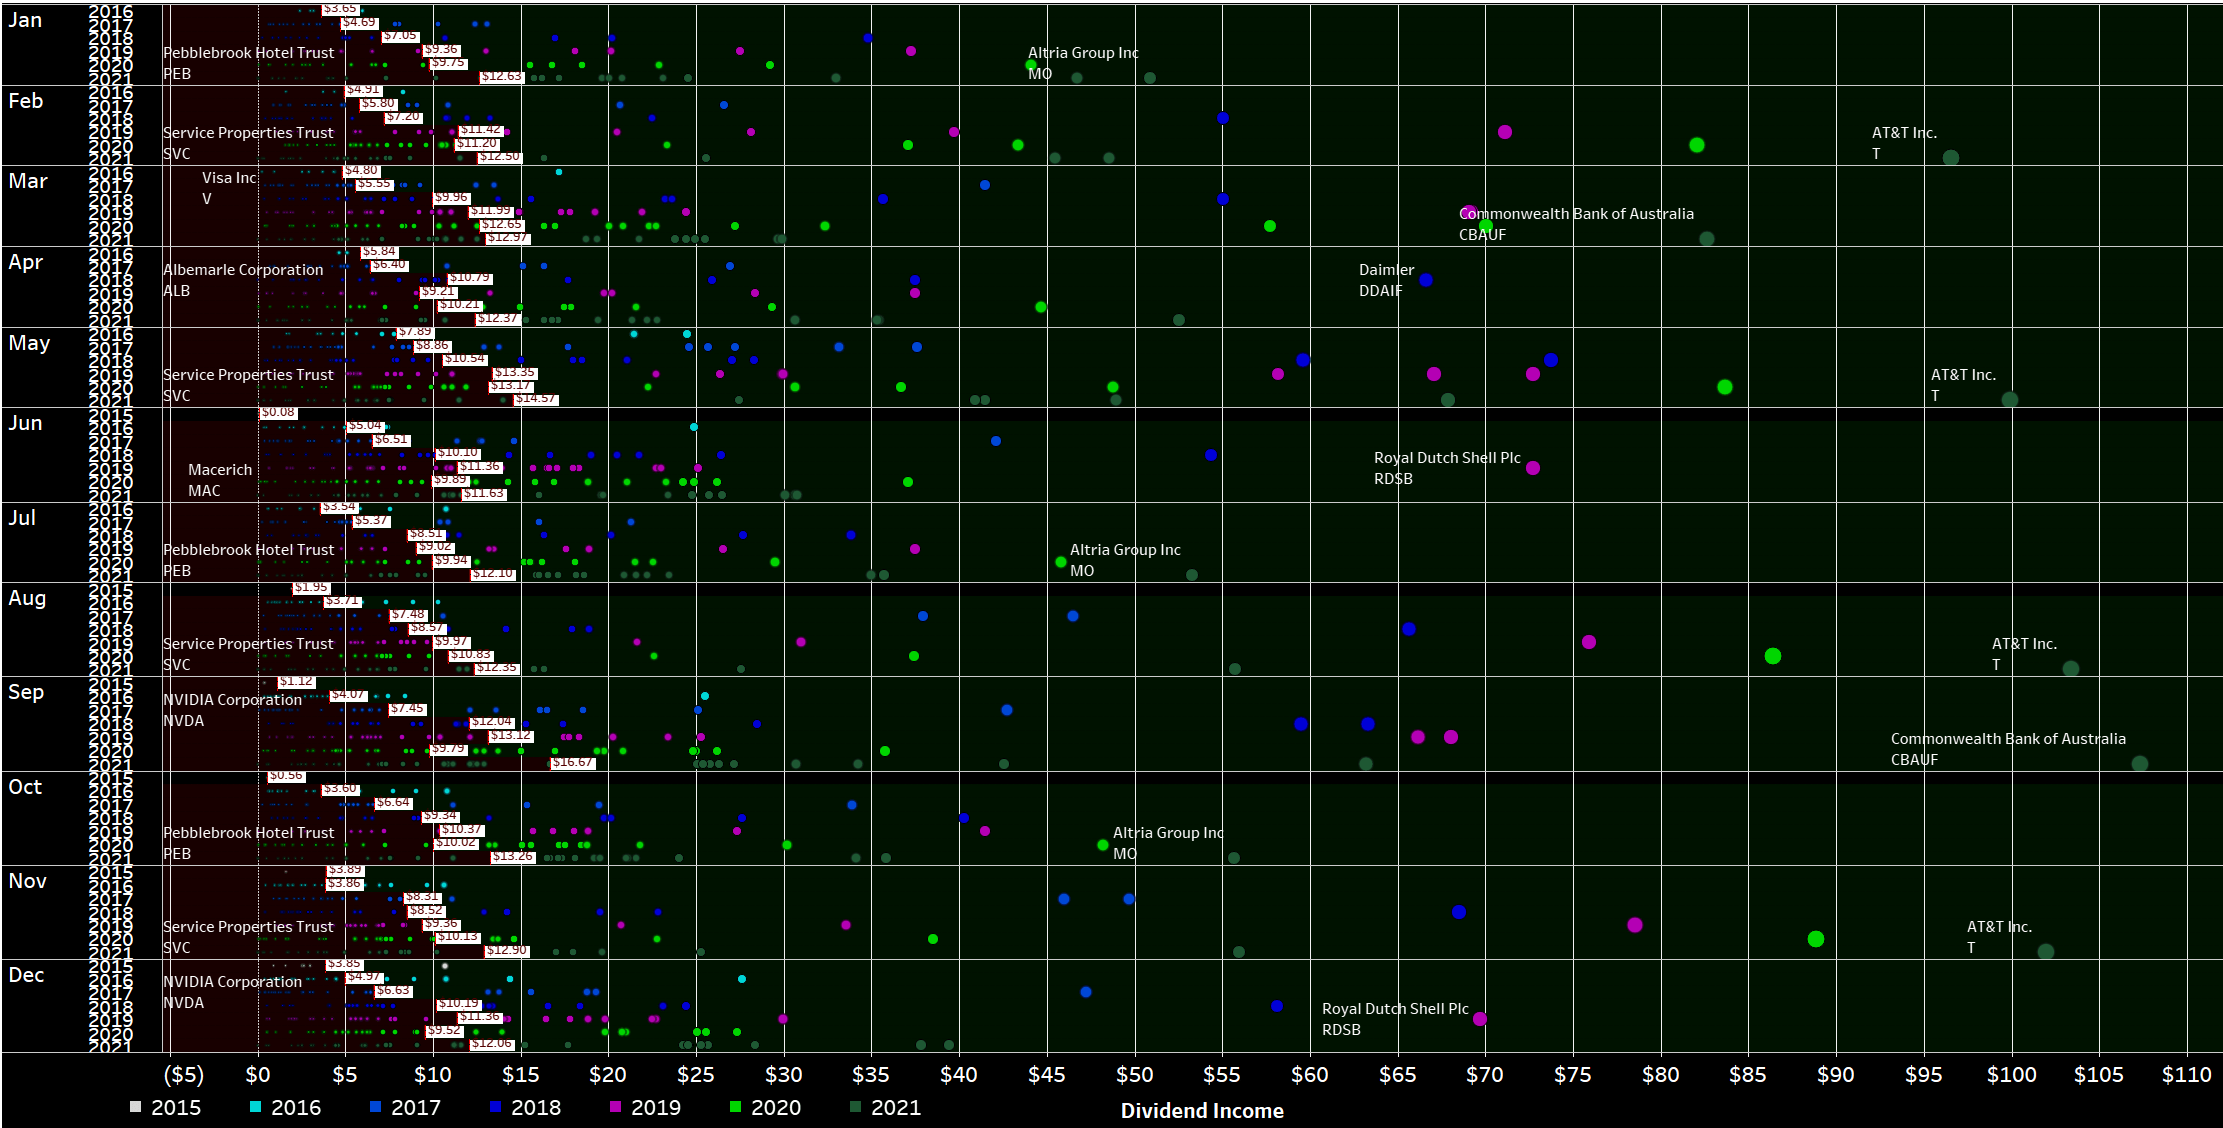
Next, I have scattered all the individual dividend payments I have ever received and colored them by year, rearranging the years side by side rather than horizontally as in previous updates:
Dividend Payment Bubbles
Designed by author
This view looks very cluttered at first, but it is very rich in information. It shows every single dividend payment I have received since I started my journey in 2015 in the shape of a circle colored differently by year and size, based upon their contribution. The view is broken down by month and by year (not by year and by month), and thus allows to better see the development over time. For every year of a certain month, a white rectangle indicates the average monthly dividend. The area where dividends fall below that average is filled dark red, whereas the area above is colored dark green. Personally, I absolutely love this redesigned view of my old “bubbles chart,” as it is much clearer to identify developments and trends in my dividend income.
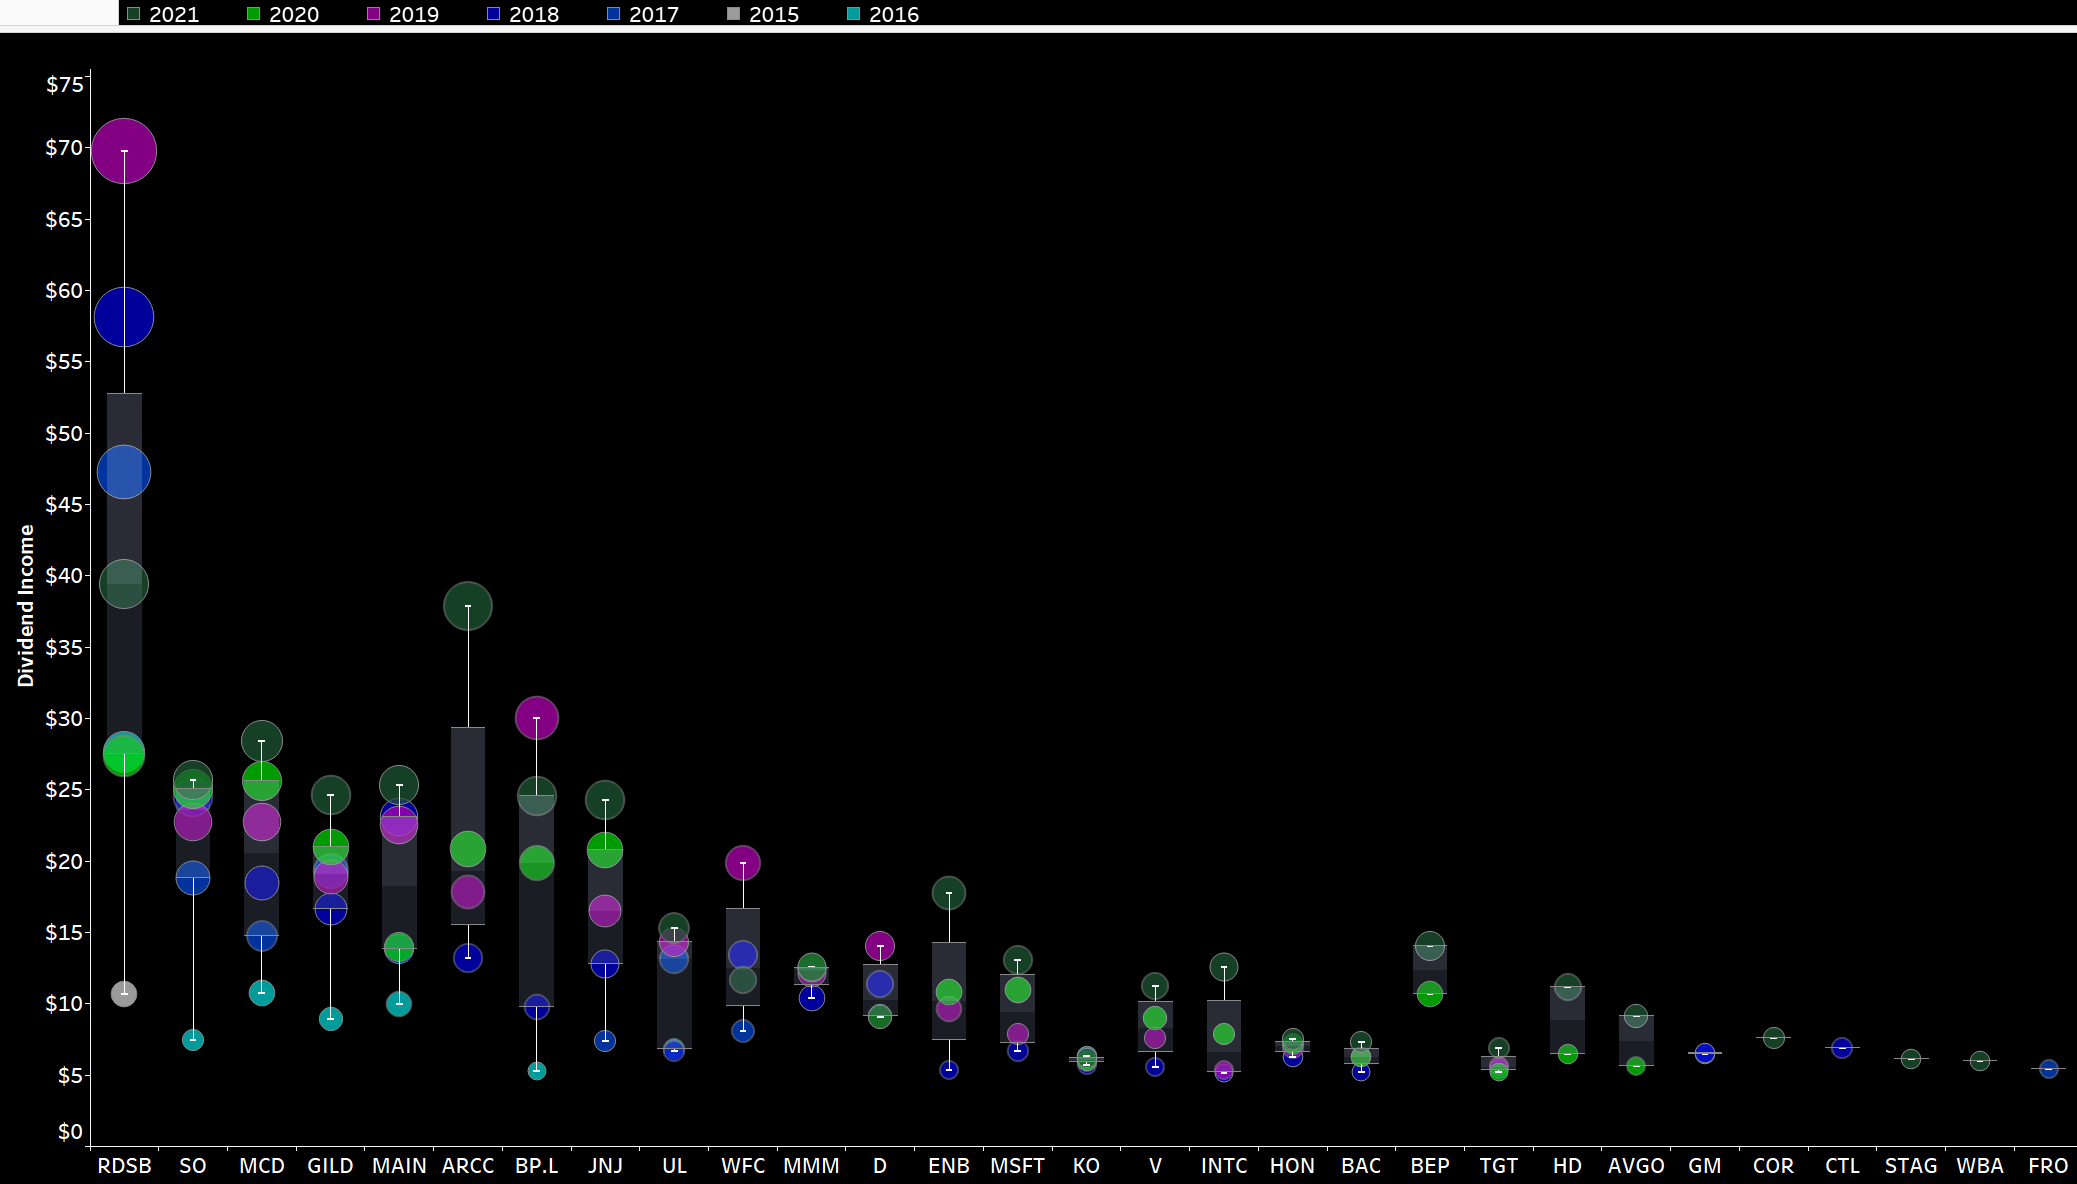
December Dividends All Years
Designed by author
Now, zooming in on December, we can immediately see a number of big green circles in a sea of black. The bigger the circle and the bigger the distance to the previous circle for the same stock, the bigger is the change in dividend income compared to the prior years.
The biggest jump in annual dividend income is attributable to the Ares Capital Corporation which is driven exclusively by ongoing investments over the last 12 months. Regarding Shell we can easily see that despite the big dividend hike this year dividend income still significantly trails the records set between 2017 and 2019 despite not having sold any shares. What’s more, we can also easily identify the big jump vs. 2020 as Shell is back on the track of growing its dividend and given very favorable macroeconomic conditions throughout the year I do expect another significant bump in dividend income next year.
Thirdly, it is crucial and satisfying to see that for almost all other stocks the dark green circle is at the top of the respective whisker plot indicating record dividend income.
Another way to express the monthly dividend income is in terms of Gifted Working Time (GWT).
I am assuming an average hourly rate of $28 for 2021 here:
- In 2018, I generated 121 hours in GWT, equaling slightly more than $3,000 in annual net dividends.
- In 2019, I generated 142 hours in GWT, equaling almost $3,600 in annual net dividends.
- In 2020, I generated 152 hours in GWT, equaling roughly $3,800 in annual net dividends.
- In 2021, I am targeting to reach at least $4,400 in annual net dividends, equaling roughly 157 hours in GWT. That is a rather bullish estimate projecting an increase in dividend income of around 16%. Given the massive purchases in 2020 and the assumption that there won’t be any further big dividend cuts in 2021 – on the contrary I am expecting solid dividend growth.
- I have comfortably surpassed my annual target with realized GWT of 180 hours eclipsing the goal of 157 hours. 2021 net dividend income now amounts to over $5,000 marking a major milestone in my dividend journey. It was a tight finish but I am delighted to have achieved that next $1,000 milestone and look forward to hitting the next within the next 2 years.
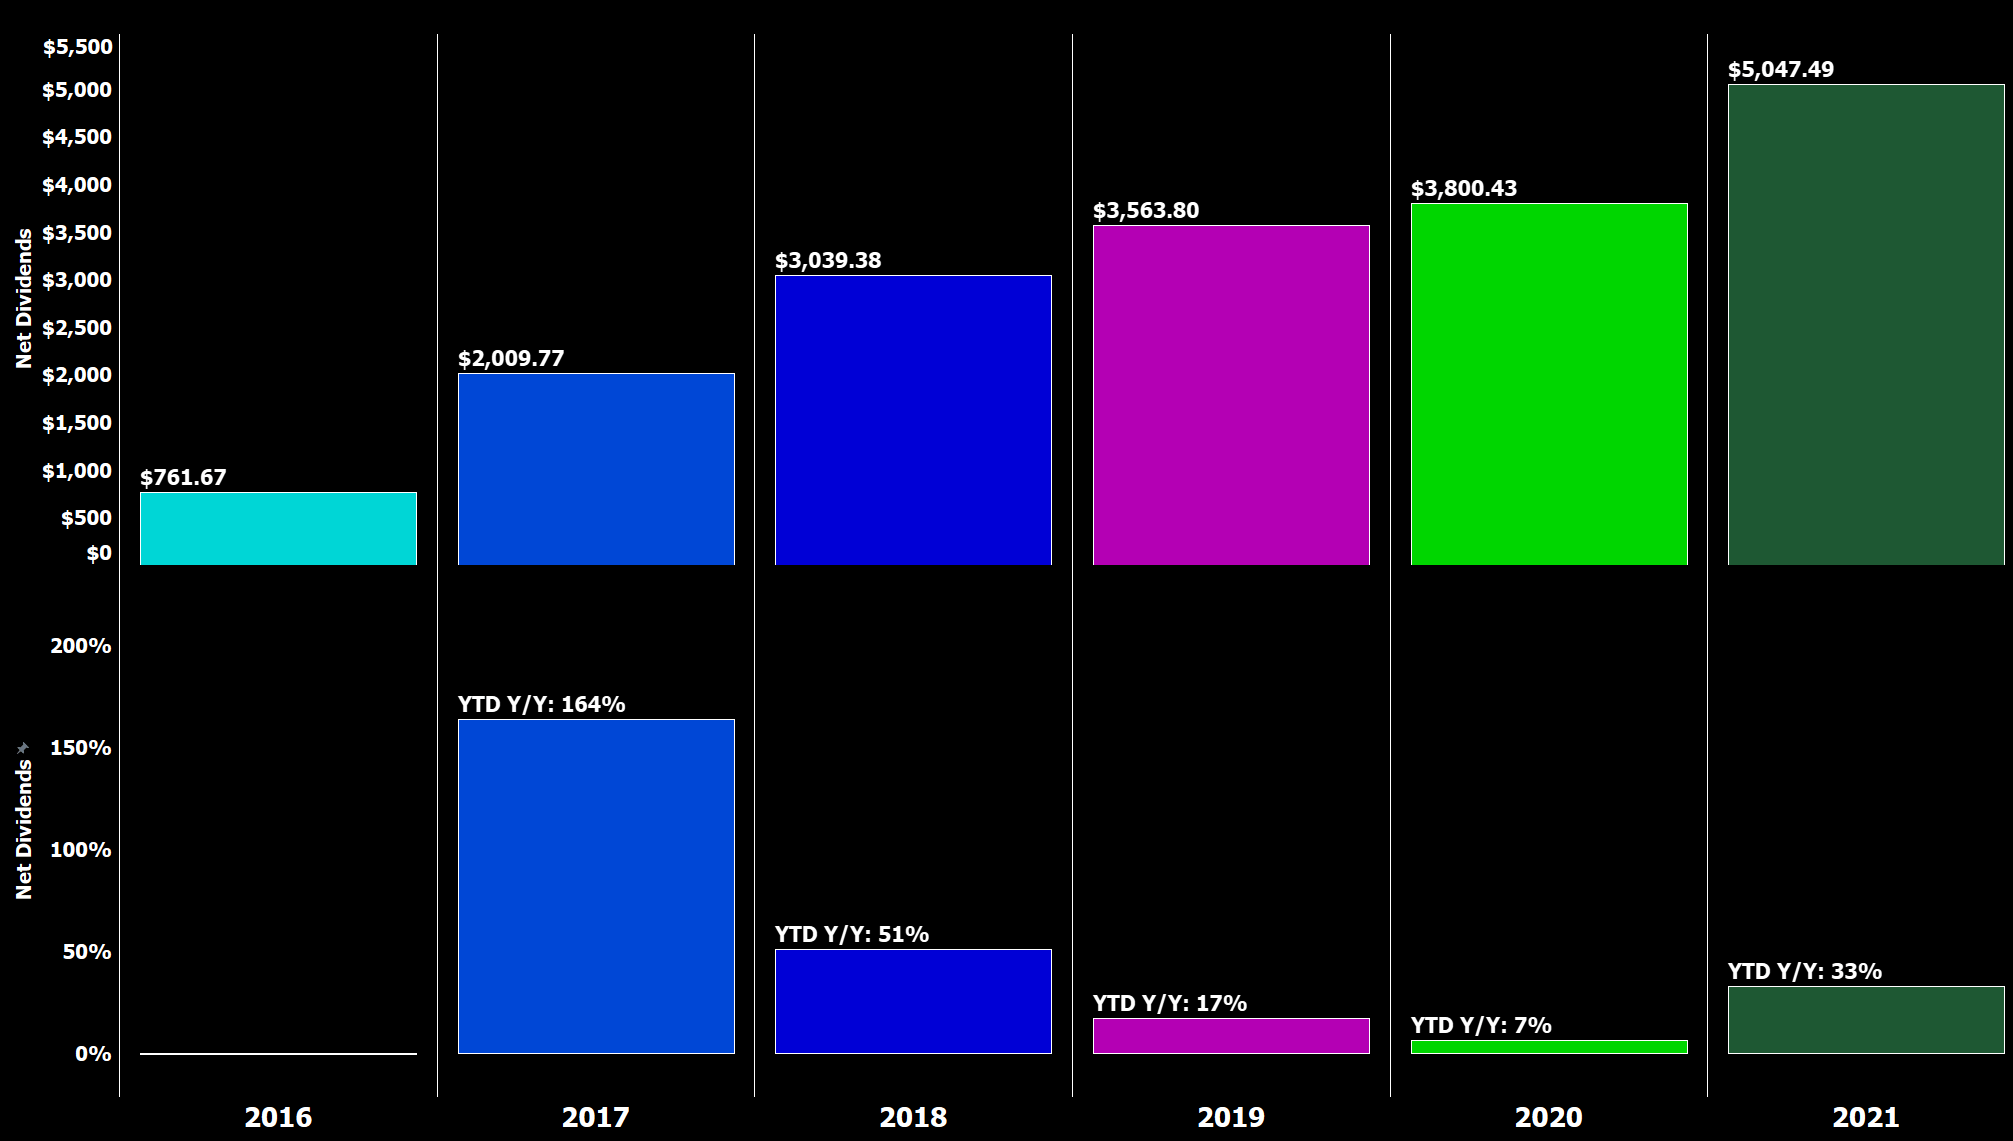
YTD Dividend Gains
Designed by author
Across the years, the YTD Dividend Race as I like to call it looks as follows. While 2020 was fairly disappointing, I am very excited about 2021, and with the low baseline from the prior year I am expecting an easy beat in 2021. Now that the year is almost over we can clearly see how far the light green and dark green lines are away from each other. As the year unfolded they have continued to diverge and the prior year dividend income metrics have been completely smashed just as expected. Over 30% Y/Y growth in dividend income is staggering but this special situation won’t repeat in the future. For the next year I am targeting a conservative high single-digit growth rate for now.
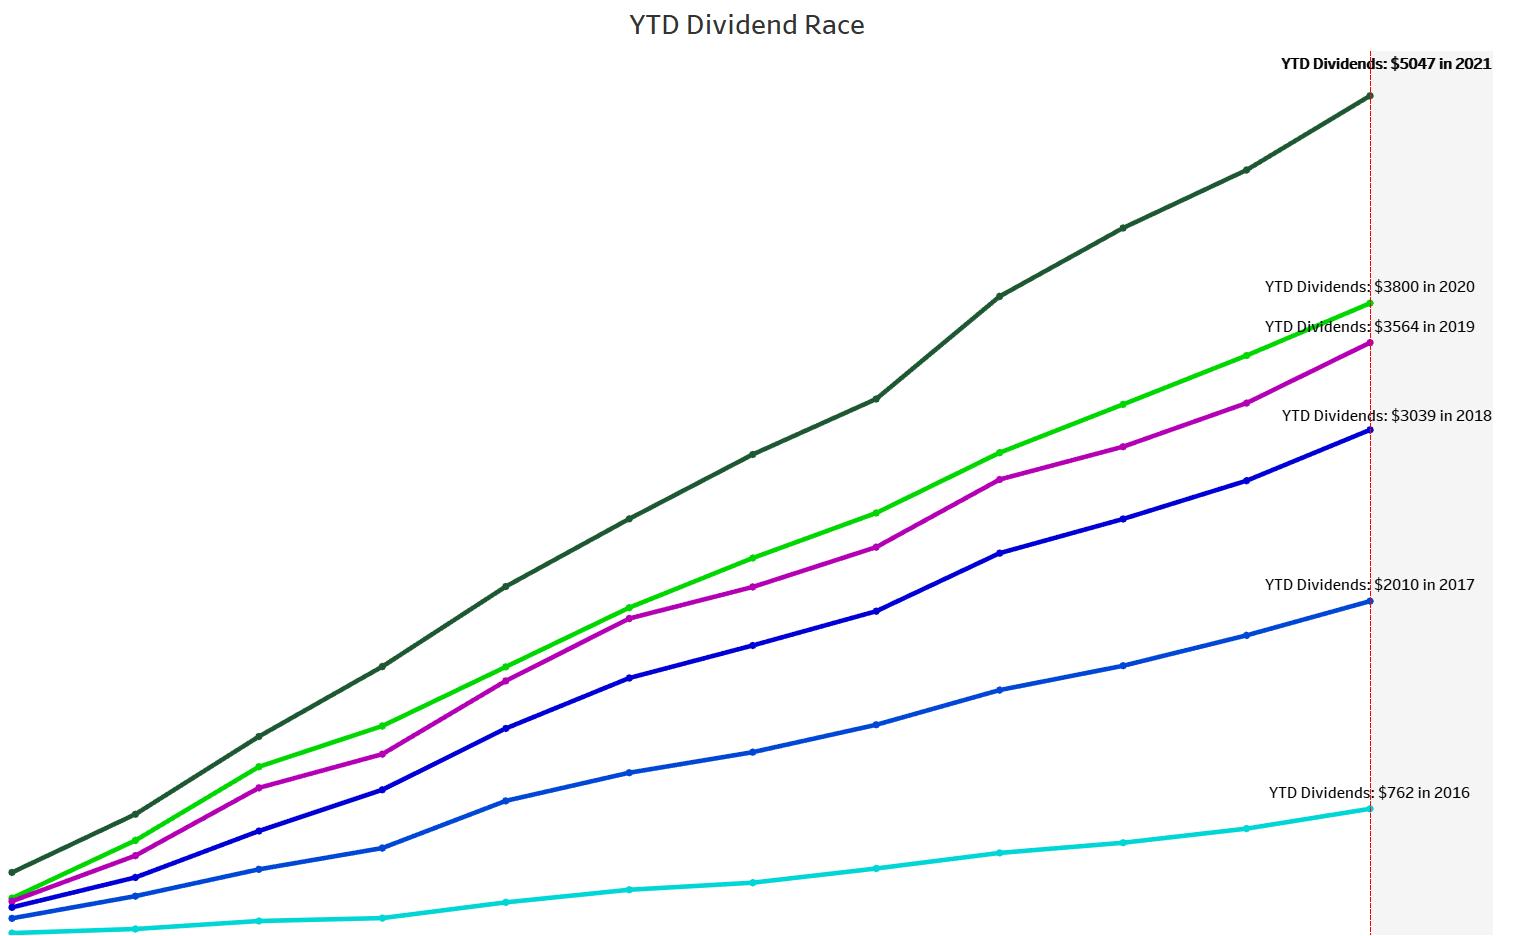
YTD Dividend Race
Designed by author
Expressed in GWT, it presents itself as follows:
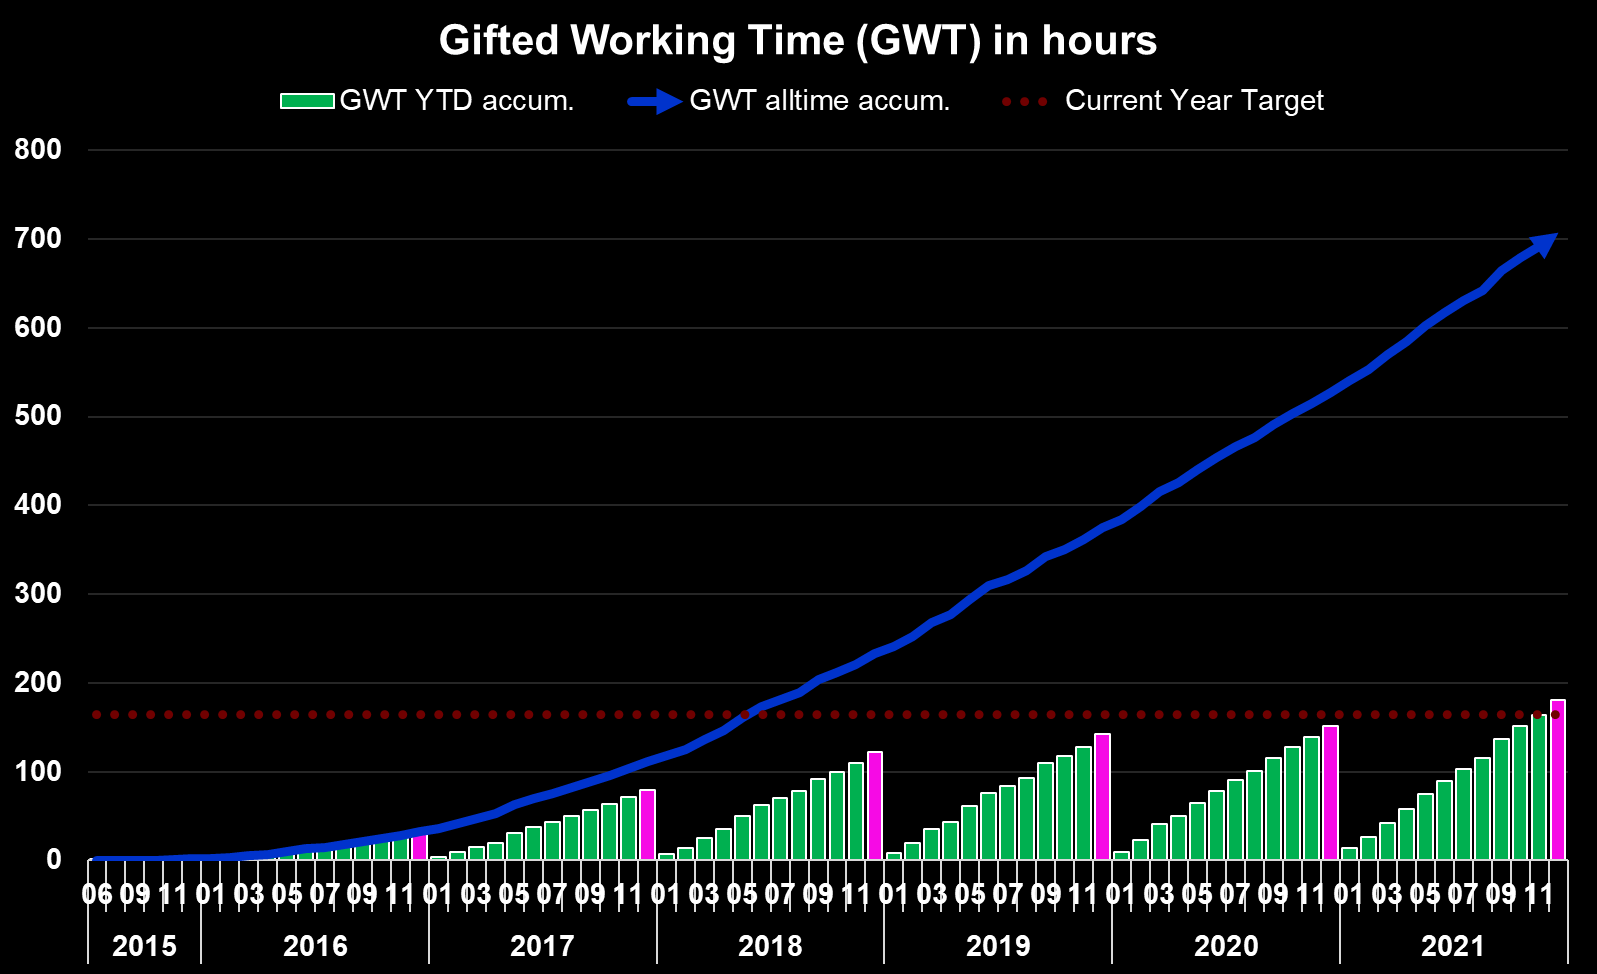
Gifted Working Time
Designed by author
What this shows is as follows:
- All time (blue area) – Around 707 hours, or 88 days, of active work have been replaced with passive income since the start of my dividend journey. Assuming a five-day workweek this translates into more than 17 weeks of vacation funded via dividends.
- YTD (green bars) – Around 180 hours, or 22.5 days, of active work have been replaced with passive income in 2021 already which is equivalent to just more than four full weeks of work.
- Highlighted in pink is the accumulated YTD total at the end of the current reporting month (December) across each year.
Upcoming January Dividends
As every month, January is packed with dividend payments heavily concentrated around the 15th and at month-end when the dividend checks from Canada’s big banks as well as JPMorgan (JPM.PK) will be arriving over a period of just 3-4 days.
Given the majority of my savings plans feature companies that pay dividends in January such as W. P. Carey, Altria (MO), Cisco Systems (CSCO), JPMorgan, Toronto-Dominion Bank (TD), Bank of Nova Scotia (BNS), Stryker (SYK), Medtronic (MDT) as well as ongoing investments into stocks like New Residential Investment Corp., Annaly Capital (NYSE:NLY) and APTS, it surely is going to be a big month that could potentially set a new all-time dividend record for the month of January .
The snapshot below is taken from my newly and free-for-all released Dividend Calendar (make sure to follow instructions in the video) and shows my expected dividend payments in January .

Dividend Calendar
My Dividend Portfolio Composition (Excludes Non-Dividend-Paying Companies)
At the end of December, my dividend portfolio is composed as follows:
| Company Name | Ticker | % Market Value | Market Value (€) |
| Apple Inc. | (AAPL) | 11.94% | 22,551 |
| Visa Inc | (V) | 4.11% | 7,758 |
| Microsoft Corporation | (MSFT) | 3.75% | 7,079 |
| Mcdonald’s Corp | (MCD) | 3.45% | 6,507 |
| AbbVie Inc | (ABBV) | 3.35% | 6,327 |
| Cisco Systems, Inc. | (CSCO) | 3.34% | 6,307 |
| AT&T Inc. | (T) | 3.08% | 5,811 |
| Commonwealth Bank of Australia | (OTCPK:CBAUF) | 2.51% | 4,736 |
| Johnson & Johnson | (JNJ) | 2.50% | 4,719 |
| Main Street Capital Corporation | (MAIN) | 2.05% | 3,872 |
| Wells Fargo & Co | (WFC) | 1.98% | 3,746 |
| JPMorgan Chase & Co. | (JPM.PK) | 1.92% | 3,626 |
| NVIDIA Corporation | (NVDA) | 1.91% | 3,597 |
| Royal Dutch Shell Plc | (NYSE:RDS.B) | 1.79% | 3,383 |
| W.P. Carey | (WPC) | 1.77% | 3,349 |
| Toronto-Dominion Bank | (TD) | 1.74% | 3,294 |
| Altria Group Inc | (MO) | 1.73% | 3,262 |
| Home Depot | (HD) | 1.67% | 3,157 |
| Siemens Healthineers | (OTCPK:SEMHF) | 1.67% | 3,150 |
| Southern Co | (SO) | 1.63% | 3,081 |
| Texas Instruments Incorporated | (TXN) | 1.62% | 3,065 |
| Stag Industrial Inc | (STAG) | 1.62% | 3,051 |
| Bank of Nova Scotia | (BNS) | 1.55% | 2,936 |
| Gilead Sciences, Inc. | (GILD) | 1.44% | 2,713 |
| Allianz SE | (OTCPK:ALIZF) | 1.20% | 2,260 |
| Intel Corporation | (INTC) | 1.16% | 2,196 |
| Sino AG | (XTP.F) | 1.12% | 2,120 |
| Ares Capital Corporation | (ARCC) | 1.12% | 2,107 |
| Morgan Stanley | (MS.PK) | 1.12% | 2,106 |
| Medical Properties Trust | (MPW) | 1.10% | 2,084 |
| Blackstone Group LP | (BX) | 1.09% | 2,054 |
| Bank of America Corp | (BAC.PK) | 1.03% | 1,948 |
| BMW | (OTCPK:BMWYY) | 0.99% | 1,877 |
| Procter & Gamble Co | (PG) | 0.98% | 1,852 |
| PepsiCo, Inc. | (PEP) | 0.95% | 1,788 |
| Canadian Imperial Bank of Commerce | (CM) | 0.93% | 1,747 |
| STORE Capital | (STOR) | 0.92% | 1,742 |
| Target Corporation | (TGT) | 0.86% | 1,625 |
| 3M Co | (MMM) | 0.84% | 1,584 |
| Broadcom Inc | (AVGO) | 0.84% | 1,579 |
| Enbridge | (ENB) | 0.82% | 1,542 |
| Philip Morris International Inc. | (PM) | 0.81% | 1,520 |
| Honeywell International Inc. | (HON) | 0.80% | 1,519 |
| Preferred Apartment Communities | (APTS) | 0.80% | 1,513 |
| Daimler | (OTCPK:DDAIF) | 0.78% | 1,478 |
| B&G Foods, Inc. | (BGS) | 0.75% | 1,425 |
| BP1 | (BP) | 0.63% | 1,187 |
| Brookfield Renewable Partners | (BEP) | 0.59% | 1,111 |
| Dominion Energy Inc | (D) | 0.56% | 1,059 |
| The Coca-Cola Co | (KO) | 0.56% | 1,053 |
| Verizon Communications Inc. | (VZ) | 0.55% | 1,030 |
| BP2 | (BP) | 0.54% | 1,027 |
| Royal Bank of Canada | (RY) | 0.52% | 987 |
| Nextera Energy Partners LP | (NEP) | 0.52% | 975 |
| New Residential | (NRZ) | 0.51% | 966 |
| Unilever NV ADR | (UL) | 0.50% | 947 |
| BASF | (OTCQX:BASFY) | 0.49% | 927 |
| Starwood Property Trust, Inc. | (STWD) | 0.49% | 919 |
| Apple Hospitality REIT | (APLE) | 0.47% | 888 |
| Stryker | (SYK) | 0.46% | 877 |
| CVS Health Corp | (CVS) | 0.44% | 835 |
| Realty Income Corp | (O) | 0.43% | 820 |
| Walgreens Boots Alliance Inc | (WBA) | 0.41% | 776 |
| Walt Disney Co | (DIS) | 0.37% | 695 |
| Pfizer Inc. | (PFE) | 0.36% | 687 |
| AGNC Investment Corporation | (AGNC) | 0.35% | 656 |
| General Electric Company | (GE) | 0.33% | 625 |
| General Mills, Inc. | (GIS) | 0.32% | 604 |
| Medtronic | (MDT) | 0.32% | 601 |
| NextEra Energy | (NEE) | 0.30% | 574 |
| Sixt | (OTC:SXTSY) | 0.29% | 546 |
| Antero Midstream Corporation | (AM) | 0.26% | 494 |
| Alibaba Group Holding Ltd | (BABA) | 0.24% | 457 |
| Kinder Morgan Inc | (KMI) | 0.24% | 456 |
| Colgate-Palmolive Company | (CL) | 0.20% | 372 |
| Exxon Mobil Corporation | (XOM) | 0.19% | 358 |
| Mastercard | (MA) | 0.18% | 344 |
| Omega Healthcare Investors Inc | (OHI) | 0.18% | 331 |
| Brookfield Infrastructure Partners L.P. | (BIP) | 0.16% | 311 |
| Annaly Capital Management | (NLY) | 0.16% | 310 |
| MPLX LP | (MPLX) | 0.16% | 301 |
| Bayer AG | (OTCPK:BAYZF) | 0.16% | 293 |
| Apollo Commercial Real Est. Finance Inc | (ARI) | 0.13% | 253 |
| BRT Apartments Corp. | (BRT) | 0.13% | 240 |
| Uniti Group Inc | (UNIT) | 0.12% | 230 |
| Enterprise Products Partners L.P. | (EPD) | 0.12% | 227 |
| Fresenius SE | (OTCPK:FSNUF) | 0.11% | 206 |
| Prudential Financial | (PRU) | 0.11% | 202 |
| Lumen Technologies | (LUMN) | 0.10% | 182 |
| Apollo Investment | (AINV) | 0.09% | 162 |
| Boeing | (BA) | 0.07% | 140 |
| Diversified Healthcare Trust | (DHC) | 0.07% | 129 |
| Equitrans Midstream Coporation | (ETRN) | 0.07% | 128 |
| Newtek Business Services | (NEWT) | 0.06% | 121 |
| Vonovia | (OTCPK:VONOY) | 0.06% | 118 |
| Fresenius Medical Care | (FMS) | 0.06% | 112 |
| Bank of Montreal | (BMO) | 0.05% | 100 |
| The GEO Group Inc | (GEO) | 0.03% | 49 |
| Service Properties Trust | (SVC) | 0.02% | 43 |
| Macquarie Infrastructure Corp | (MIC) | 0.01% | 16 |
from WordPress https://ift.tt/3tshyKy
via IFTTT
No comments:
Post a Comment